Batteries are complex electrochemical and thermodynamic systems, and multiple factors impact battery performance. Of course, battery chemistry is at the top of the list. Still, factors such as charge and discharge rates, operating temperatures, storage conditions, physical construction details, and more come into play when understanding which battery best suits a specific application. To begin, several terms need to be defined:
- Open Circuit Voltage (Voc) is the voltage between the battery terminals when there is no load on the battery.
- Terminal Voltage (Vt) is the voltage between the battery terminals when a load is applied; this is typically lower than Voc.
- Cut-off Voltage (Vco) is the voltage at which the battery is specified to be fully discharged. While there is usually charge remaining, operation at voltages lower than Vco can damage the battery.
- Capacity measures the total amp-hours (AH) that can be drawn from a battery in a fully charged state until Vt reaches Vco.
- Charge Rate (C‐rate) is the rate of charge or discharge of a battery relative to its rated capacity. For example, a 1C rate will fully charge or discharge a battery in 1 hour. At a discharge rate of 0.5C, a battery will be fully discharged in 2 hours. The use of high C-rates typically reduces available battery capacity and can cause damage to the battery.
- State-of-Charge (SoC) quantifies the remaining battery capacity as a percentage of maximum capacity. When SoC reaches zero and Vt reaches Vco, there may be charge remaining in the battery, but the battery cannot be further discharged without experiencing some damage and impaired capacity in the future.
- Depth of Discharge (DoD) is the complement of SoC and measures the battery capacity percentage that has already been discharged; DoD = 100 – SoC.
- Cycle Life is the number of available cycles before a battery reaches the end of its useful life.
- End of Life (EoL) of a battery is reached when the battery cannot perform according to its predefined minimum specifications. EoL can be quantified in several ways:
- Capacity fading is based on a given percentage drop in the battery capacity compared to its rated capacity under specified conditions.
- Power fading is based on a given percentage drop in the battery’s maximum power compared to the rated power, also under specified conditions.
- Energy throughput quantifies the total amount of energy a battery is expected to handle during its life, for example, 30MWh, based on specific operating conditions.
- State of Health (SoH) of a battery measures the percentage of useful life remaining before the battery reaches EoL.
Polarization curves
Battery discharge curves are based on battery polarization that occurs during discharge. The amount of energy that a battery can supply, corresponding to the area under the discharge curve, is strongly related to operating conditions such as the C-rate and operating temperature. During discharge, batteries experience a drop in Vt. The drop in Vt is related to several factors, primarily:
- IR drop – The drop in cell voltage due to the current flowing across the battery’s internal resistance. This factor increases in a mostly linear slope at higher discharge rates, at a constant temperature.
- Activation polarization – Refers to the various retarding factors inherent to the kinetics of an electrochemical reaction, like the work function ions must overcome at the junction between the electrodes and the electrolyte.
- Concentration polarization – This factor considers the resistance faced by the mass transfer (diffusion) process by which ions are transported across the electrolyte from one electrode to another. This factor dominates as a Li-ion battery is fully discharged, where the slope of the curve becomes very steep.
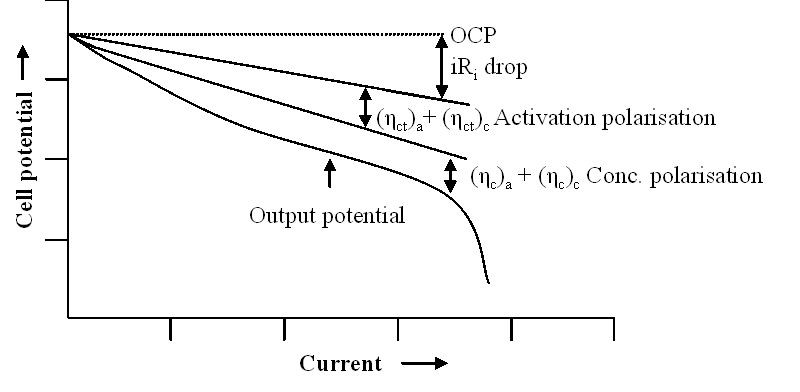
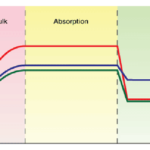
Polarization curve (discharge curve) of a battery shows the cumulative impact of the IR drop, Activation polarization, Concentration polarization on Vt (cell potential). (Image: BioLogic)
Discharge curve considerations
Batteries have been designed for a wide range of applications and offer a wide range of performance characteristics. For example, at least six basic Lithium-ion (Li-ion) chemistries, each with its own set unique feature set. Discharge curves typically plot Vt on the Y-axis and SoC (or DoD) on the X-axis. Since battery performance is related to various parameters such as the C-rate and operating temperature, each battery chemistry has a family of discharge curves based on a specific mix of operating parameters. For example, the graph below compares the discharge for two common Li-ion chemistries with lead-acid at room temperature and a 0.2C discharge rate. The shape of the discharge curves has important implications for designers.
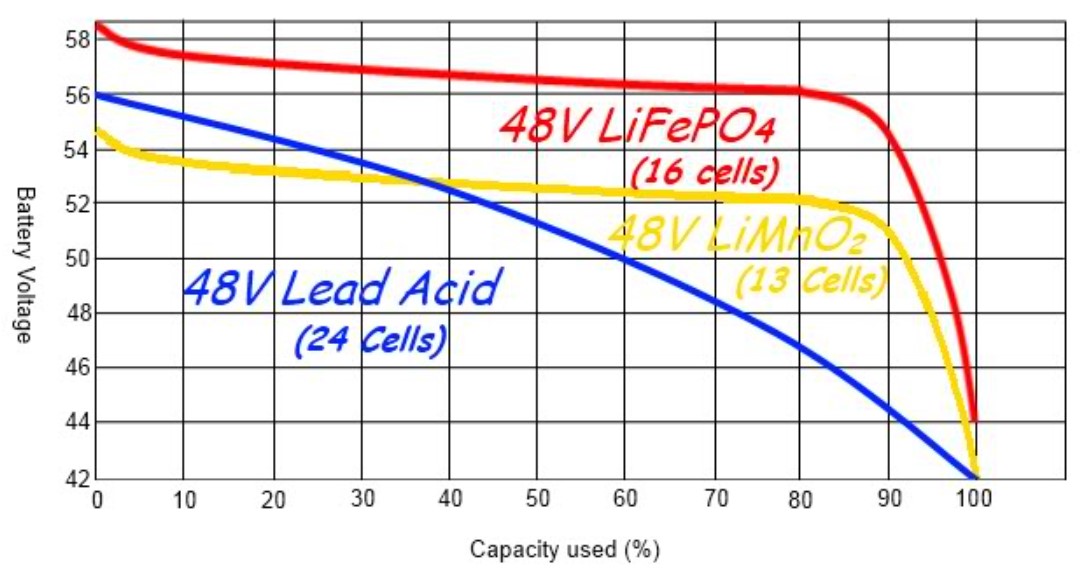
Li-ion versus lead acid discharge curves using a 0.2C discharge rate. (Image: Off Grid Ham)
A flat discharge curve may simplify certain application designs since the battery voltage remains fairly constant throughout the discharge cycle. On the other hand, a sloping curve can simplify the estimation of SoC since the battery voltage is closely related to the remaining charge in the cell. However, for Li-ion cells with flat discharge curves, the estimation of SoC requires more complex methods such as Coulomb counting that measures the discharging current of a battery and integrates the current over time to estimate SoC.
In addition, the power from cells with a downward sloping discharge curve falls throughout the discharge cycle. It may be necessary to “oversize” batteries to support high power applications towards the end of the discharge cycle. A boost voltage regulator is often needed to power sensitive devices and systems using a battery with a steeply sloping discharge curve.
The discharge curves for a Li-ion battery below show that the effective capacity is reduced if the cell is discharged at very high rates (or conversely increased with low discharge rates). This is called the capacity offset, and the effect is common to most cell chemistries.
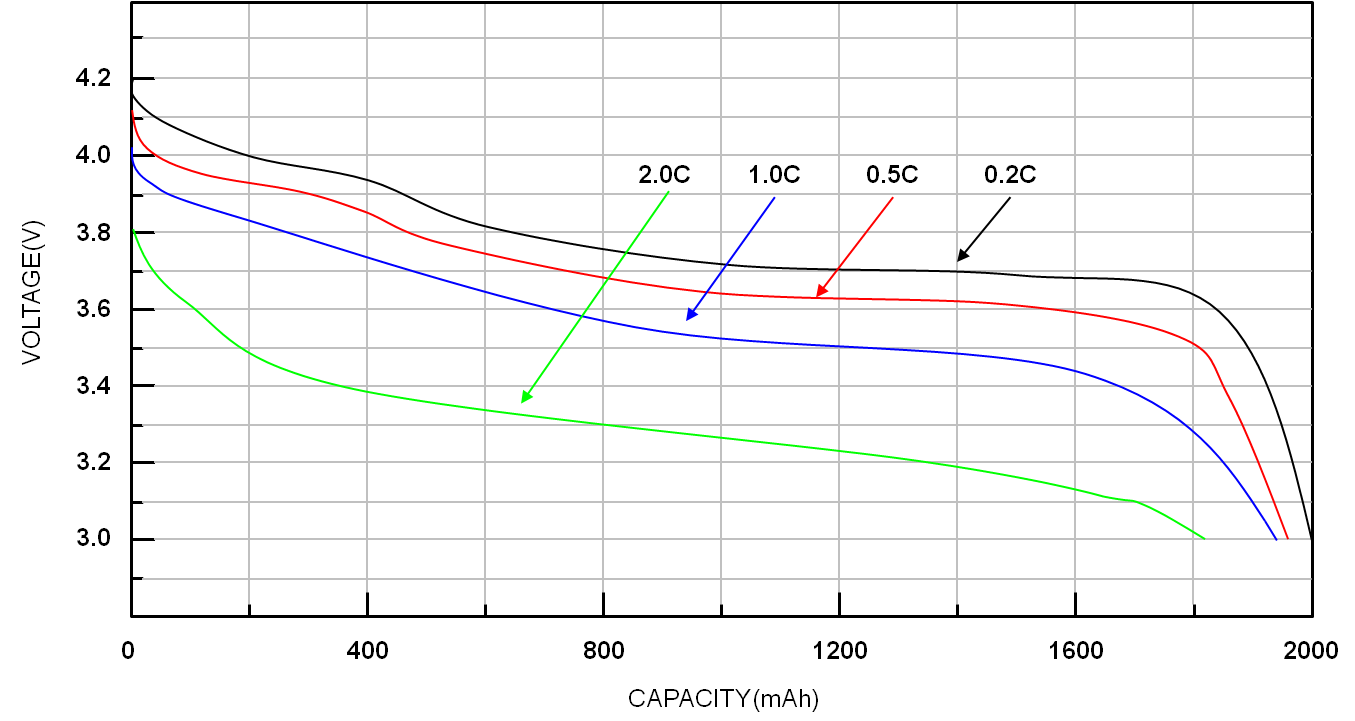
Li-ion battery voltage and capacity decline with higher C rates. (Image: Richtek)
Operating temperature is an important parameter impacting battery performance. At very low temperatures, batteries with aqueous electrolytes may freeze, placing a lower limit on the operating temperature range. Li-ion batteries undergo lithium plating of the anode at low temperatures, permanently reducing capacity. At high temperatures, chemicals can break down, and the battery ceases to function. In between freezing and chemical destruction, battery performance typically varies widely with temperature.
The graph below shows the impact on Li-ion performance at varying temperatures. At very low temperatures, the performance can be greatly reduced. But battery discharge curves are only one part of the story regarding battery performance. For example, the further the operating temperature of a Li-ion battery is from room temperature (both higher temperatures and lower temperatures), the more the cycle life degrades. A complete analysis of all the factors impacting the suitability of various battery chemistries for specific applications is beyond the scope of this look into battery discharge curves. An example of other ways to analyze the performance of different batteries is the Ragone plot.
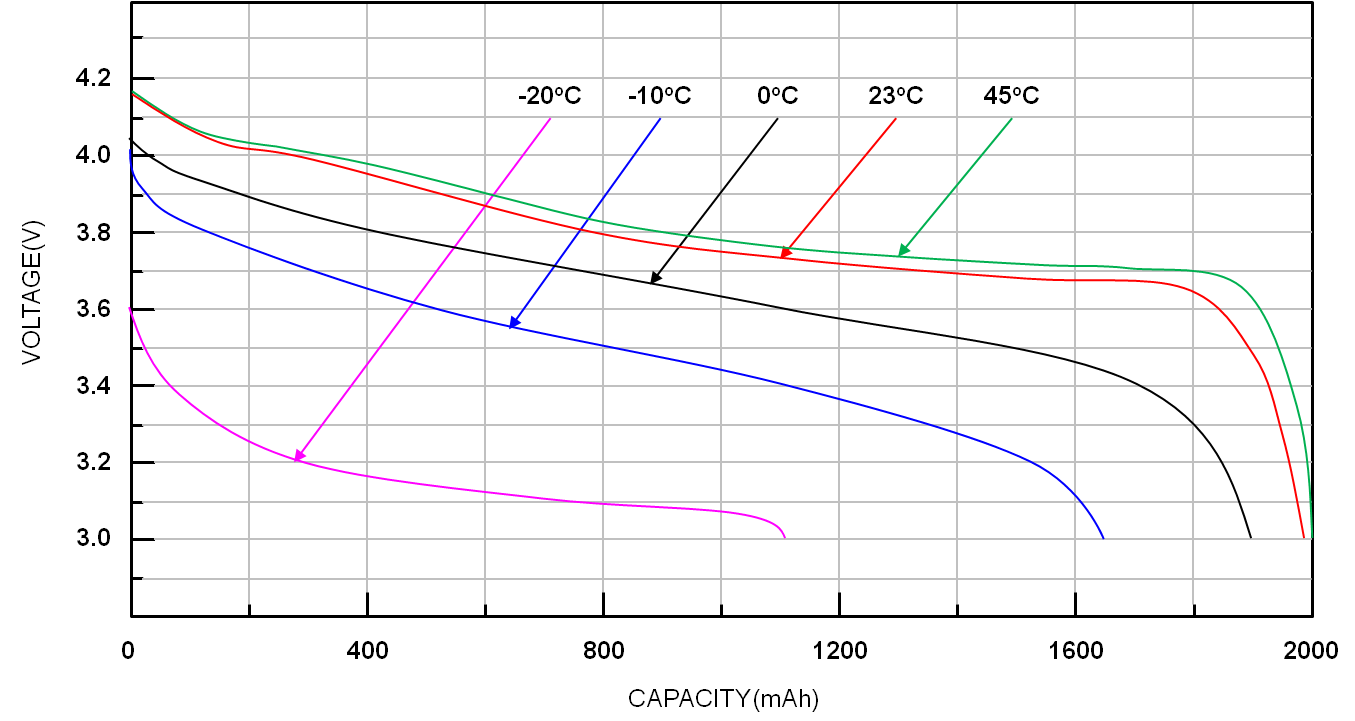
Battery voltage and capacity are temperature dependent. (Image: Richtek)
Ragone plots
A Ragone plot compares the specific power versus the specific energy of various energy storage technologies. For example, when considering electric vehicle batteries, specific energy relates to the range while specific power corresponds with acceleration.
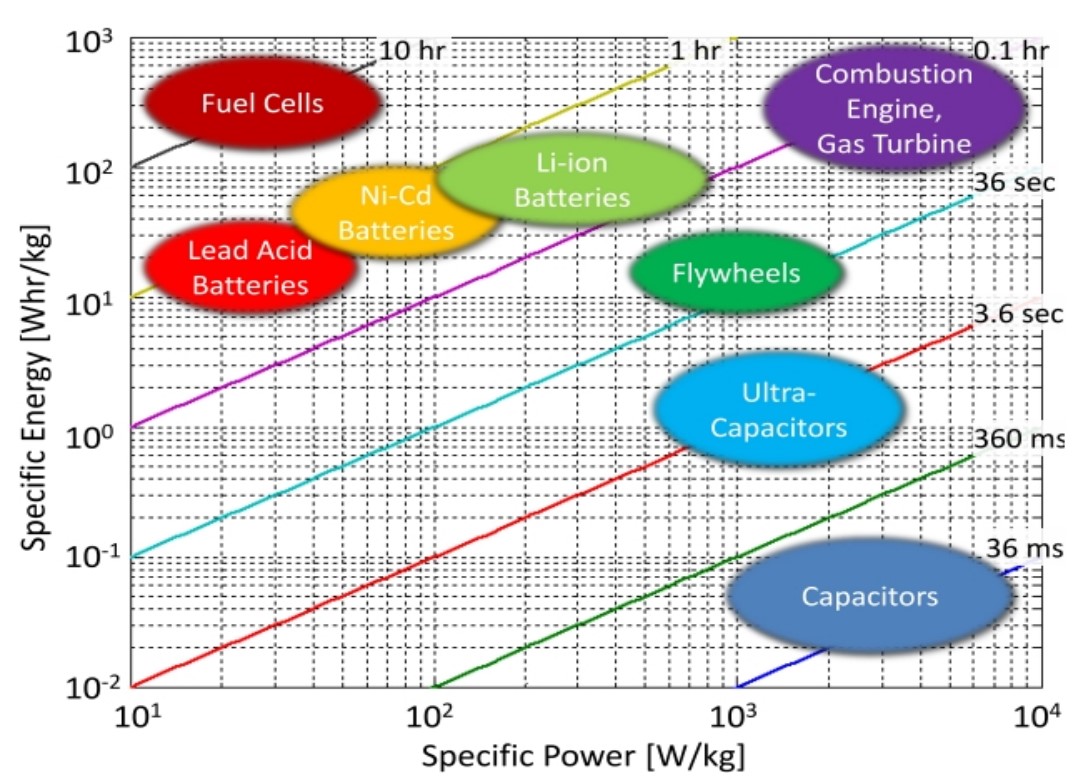
Ragone plot comparing the relationship between specific energy and specific power for various technologies. (Image: Researchgate)
Ragone plots are based on gravimetric energy and power densities and do not include any information related to volumetric parameters. While metallurgist David V. Ragone developed these plots to compare the performance of various battery chemistries, a Ragone plot is also useful for comparing any group of energy-storage devices and energy devices such as engines, gas turbines, and fuel cells.
The ratio between the specific energy on the Y-axis and the specific power on the X-axis is the number of hours that a device can be operated at its rated power. The device’s size does not impact that relationship since larger devices would have proportionally larger power and energy contents. The iso curves indicating constant operating times on a Ragone plot are straight lines.
Summary
It is important to understand battery discharge curves and the various parameters that make up the families of discharge curves associated with each specific battery chemistry. As a result of the complex electrochemical and thermodynamic systems, battery discharge curves are also complex, but they are only one way to understand the performance tradeoffs between various battery chemistries and constructions.
References
Discharge Characteristics of Li-ion, Battery University
How to read battery cycling curves, BioLogic
Li-ion Battery and Gauge Introduction, Richtek

Please explain with graph and text how battery discharge power varies with SOC ..